FOR CHIEF INFORMATION SECURITY OFFICERS
Insurance—the place you never thought to look for the data you need
Move beyond hypothetical “what if” scenarios. Insurance data grounds cyber risk in actual loss events, giving you defensible numbers to prioritize investments and speak the language your CFO understands.

THE CHALLENGE
Security decisions without credible data don’t get funded

Only 61% of CISOs today feel they are effectively aligned with their corporate boards on cyber risk.
— ProofPoint (Voice of the CISO)

CYBER RISK MANAGEMENT
Translate cybersecurity into business risk. Prove your impact.
Accelerate your journey to the strategic maturity required to protect—and power—the modern enterprise. Mitigate risk from the moment you start. Get expert help quantifying exposures and managing third-party risks.

SECURITY USE CASES
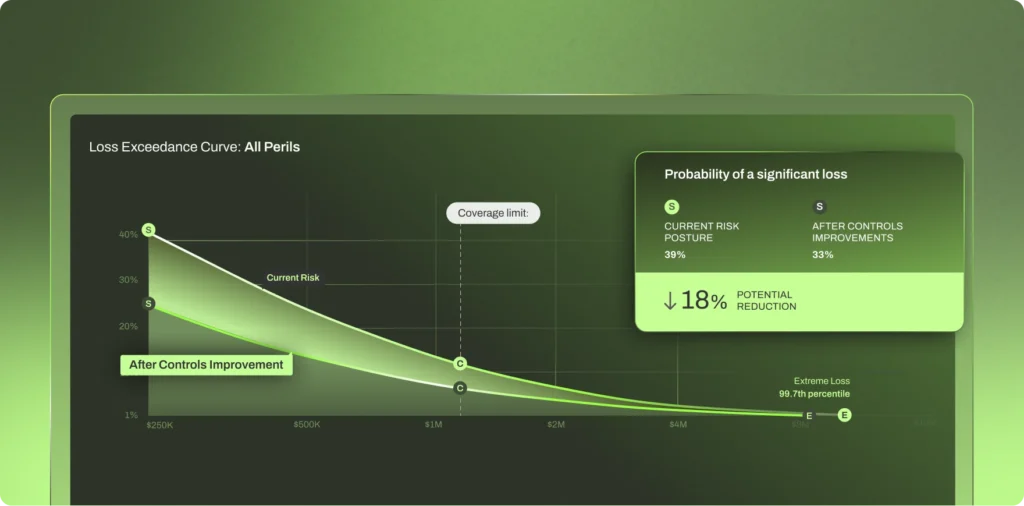
Cyber risk can be hard to understand. So we translate it to the financial language you speak: dollar impact and clear business ROI.

Risk Assessments and Quantification
Streamline assessments and see a unified financial picture of cyber risk across your ecosystem.

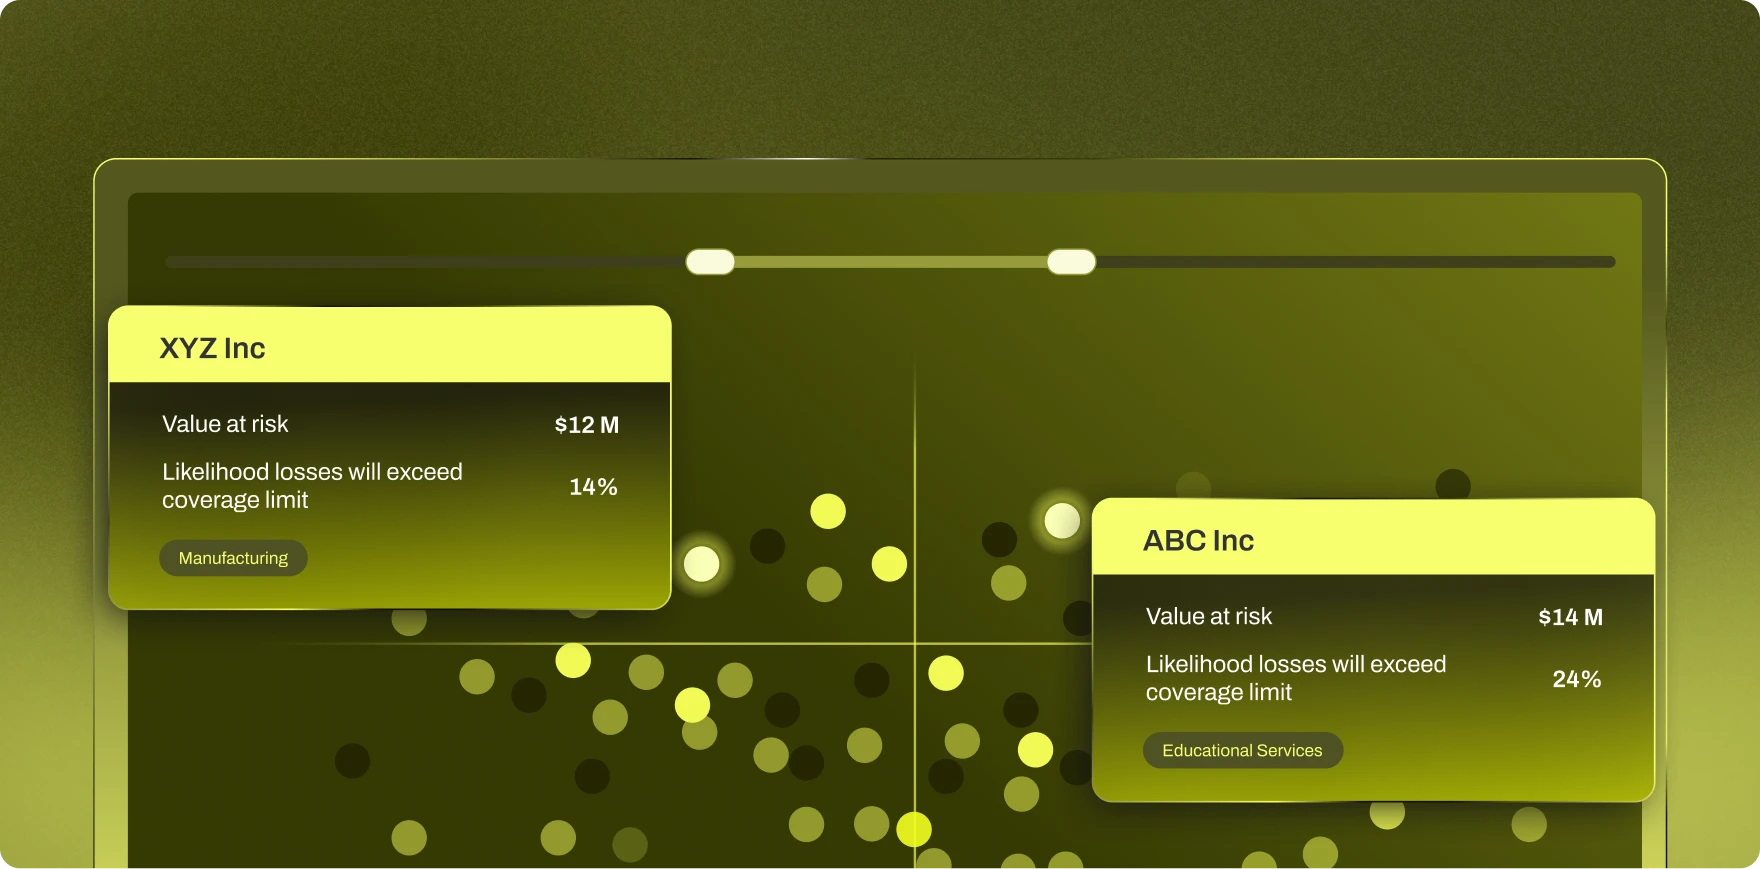
Subsidiary Risk Management
Manage risk across your portfolio with a unified financial view of cyber.
Risk Intelligence
Focus on the risks that are most likely to lead to losses through critical findings and threat actor attack simulations.
KEY BENEFITS
Make better cyber investment decisions
with risk quantified in dollar & cents

Centralized View of Risk
Our platform consolidates vendor, business, and operational risks into a single dashboard where you can track threats, measure their impact, and respond in real time. No more switching between spreadsheets and tools—everything’s in one place.

Automated Risk Assessments for All Your Entities
Replace fragmented, manual reporting with dynamic, standardized assessments across all your subsidiaries for consistent, actionable insights portfolio-wide.

Ongoing Exposure
Monitoring
Protects your organization — and its subsidiaries — with Ongoing Exposure Monitoring provided by the Resilience Risk Operation Center. Complement your enterprise risk management strategy with targeted oversight across all its business units.
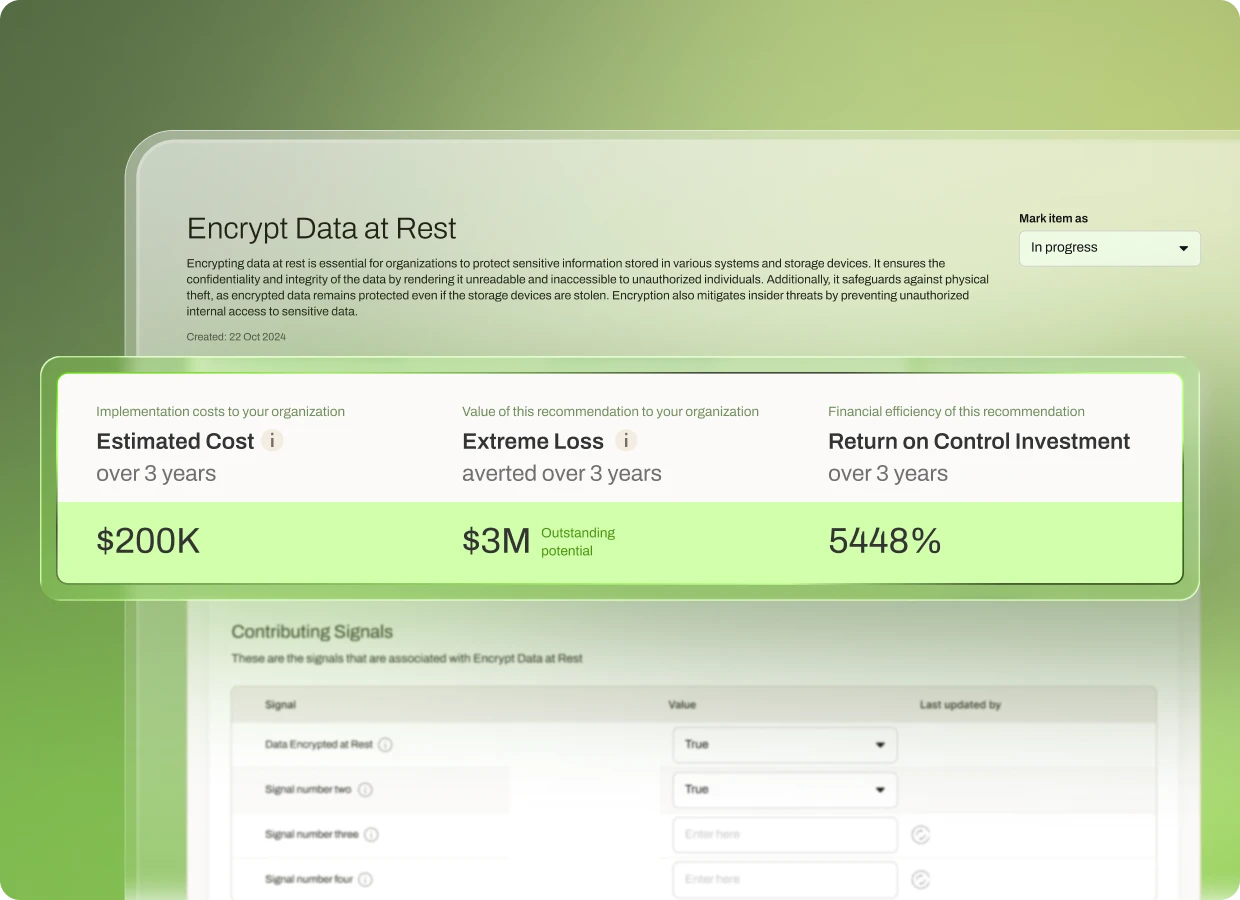
Prioritized Security Roadmap
Link security spend to measurable risk reduction. Visualize your organization’s risk posture and prioritize cybersecurity controls and mitigation efforts with financially quantified recommendations.
CUSTOMER OUTCOMES
See why security leaders trust Resilience to prevent losses with ARC
Quantify subsidiary risk within your portfolio. Improve data accuracy through direct data collection—accelerating assessments, improving visibility, and boosting long-term resilience.
%
Reduction in average critical alert volume
*compared to 2024 NIST NVD vulnerabilities
$
m
Average risk reduction per client—after full cyber action plan implementation

%
average time saved per year on security control assessments per entity
INSURANCE & RISK SOLUTIONS
Everything you need to measure and manage cyber risk

Insurance when you need it, plus resources to prevent losses in the first place. Get a comprehensive cyber insurance coverage with advanced loss-prevention tools and services.
Focus on the risks that matter most—prioritize which risks to tackle first based on validated insurance claims loss data and real human expertise.
Monitor risk across every subsidiary and portfolio company—with clear financial impact—with automated risk assessments.

CYBER RISK CALCULATOR
Do you know what your organization stands to lose to cyber risk?
Our cyber risk calculator measures your organization’s cyber risk, in dollar terms, to help you understand your risk exposure and potential financial losses.

CUSTOMER SUCCESS STORIES
Today’s most demanding
security teams rely on Resilience


Stay ahead of cyber risk with the latest
intel, best practices, and more


The time for
Resilience is now